Miss Clifford explained to us how to turn our data we collected in our pictographs into bar graphs.
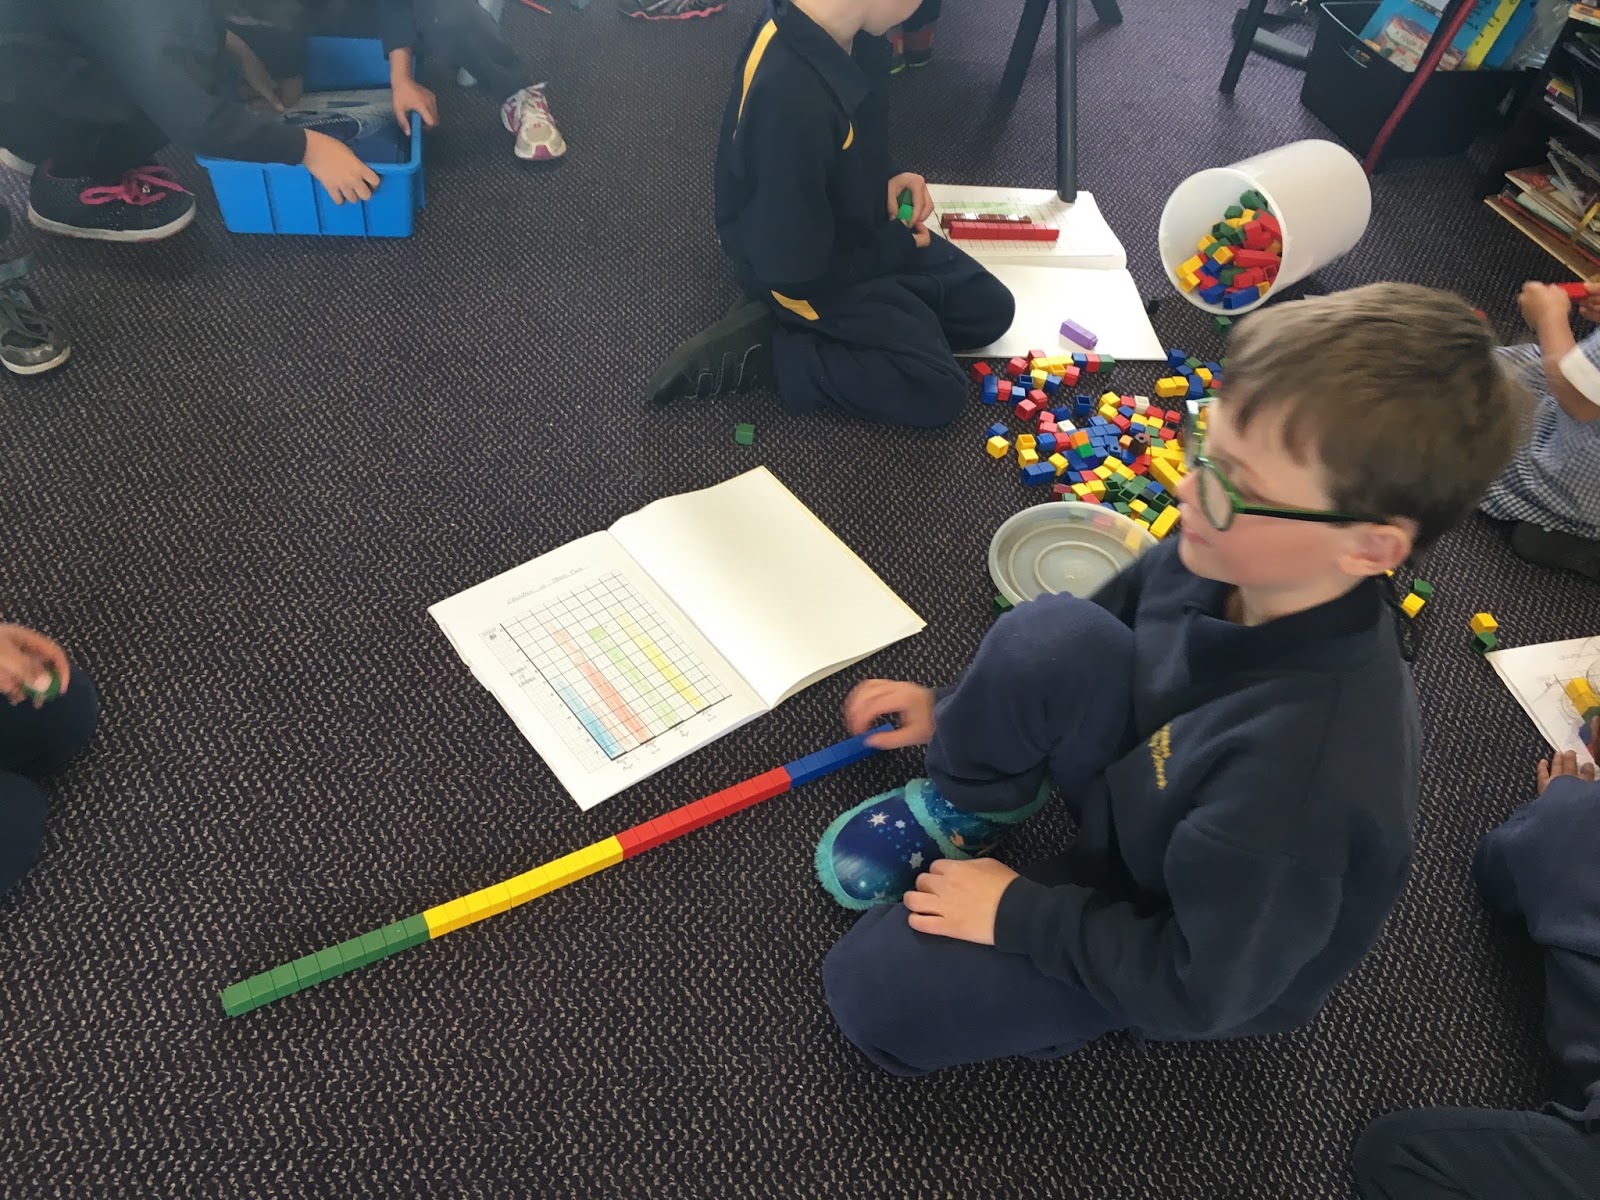
Here are some more photos of us using cubes to make our bar graphs.
Ryan found that by linking all the bars together he could turn his block bar graph into a line graph.


No comments:
Post a Comment
Please structure your comments as follows:
Positive - Something done well
Thoughtful - A sentence to let us know you actually read/watched or listened to what they had to say
Helpful - Give some ideas for next time or ask a question you want to know more about